Commonly seen: incorrect wait time calculations in the VSM
In this blog, our Master Black Belt trainer and consultant Thom Luijben discusses waiting time calculation in a Value Stream Map (VSM). A bottleneck in your process can have significant impact on wait time. Thom charges you how this works.
 Let me just start by reaching out to myself: for years I, too, made incorrect wait and lead time calculations and worse, trained others incorrectly in them. I adopted something I had been trained in by others, saw it in all kinds of Lean books and thought that was right but something gnawed at me.
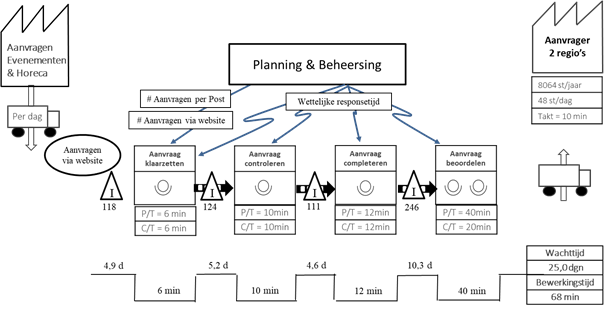
What is the issue? Let’s just take a (classic) VSM picture of a fictional example. These are hospitality and event applications in a municipality. The made VSM looks like this:

In this picture, the bottom right corner says: waiting time = 17.5 days. And I think that is incorrect.
That 17.5 days should represent the waiting time of one new product: from the time push production starts until the trip to the customer takes place. In terms of processing time, it is then the total waiting time plus the processing time of 68 minutes. How does this calculation come about? The total wait time is the addition of the indicated wait times. The different waiting times are calculated by multiplying the stock before a process step by the cycle time. To represent everything in days, we divide this time by 60×8. For example, the wait time before the “Check Request” step is:

P.S. For simplicity, things like changeover times and quality loss are excluded.
This calculation of total waiting time is incorrect because it does not take into account the bottleneck that exists in this process. The bottleneck is the process step with the longest cycle time and that is the “review request” process step with a cycle time of 20 minutes. By itself, it is true that the waiting time before purely the “check request” step is 2.6 days but because of the bottleneck, the stock for bottleneck accumulates. And all the stocks that still have to pass through the bottleneck only get through there in the frequency of every 20 minutes. So the total waiting time for a product coming in at the front end is the inventory times the cycle time of the bottleneck:

So better to calculate the wait times corresponding to the indicated inventories with the cycle time of the bottleneck. So e.g. the waiting time before the “Check Request” step is:

This then leads to the following picture:
And so this total waiting time of 25 days is substantially longer for a new product to be produced than the 17.5 suggested in the earlier picture.
One final comment. So far, we have not considered the client’s branch time. If we do, we see that the branch time is lower than the cycle time of the bottleneck. So the customer wants to receive the products at a higher rate than the process can deliver. So the customer is not satisfied. And no inventory is created at the back end of the process either. In the case where the branch time exceeds the cycle time of the bottleneck, the situation becomes different. The customer then wants to receive products at a slower rate than the process can deliver. In that case, one must count with the customer’s branch time to calculate the correct waiting time. The customer then becomes, in purely process terms, of course, the bottleneck.
Want to know more?
Want to learn more about Value Stream Mapping or our other services? Then contact us, using the form below or call us at 053 – 20 30 240