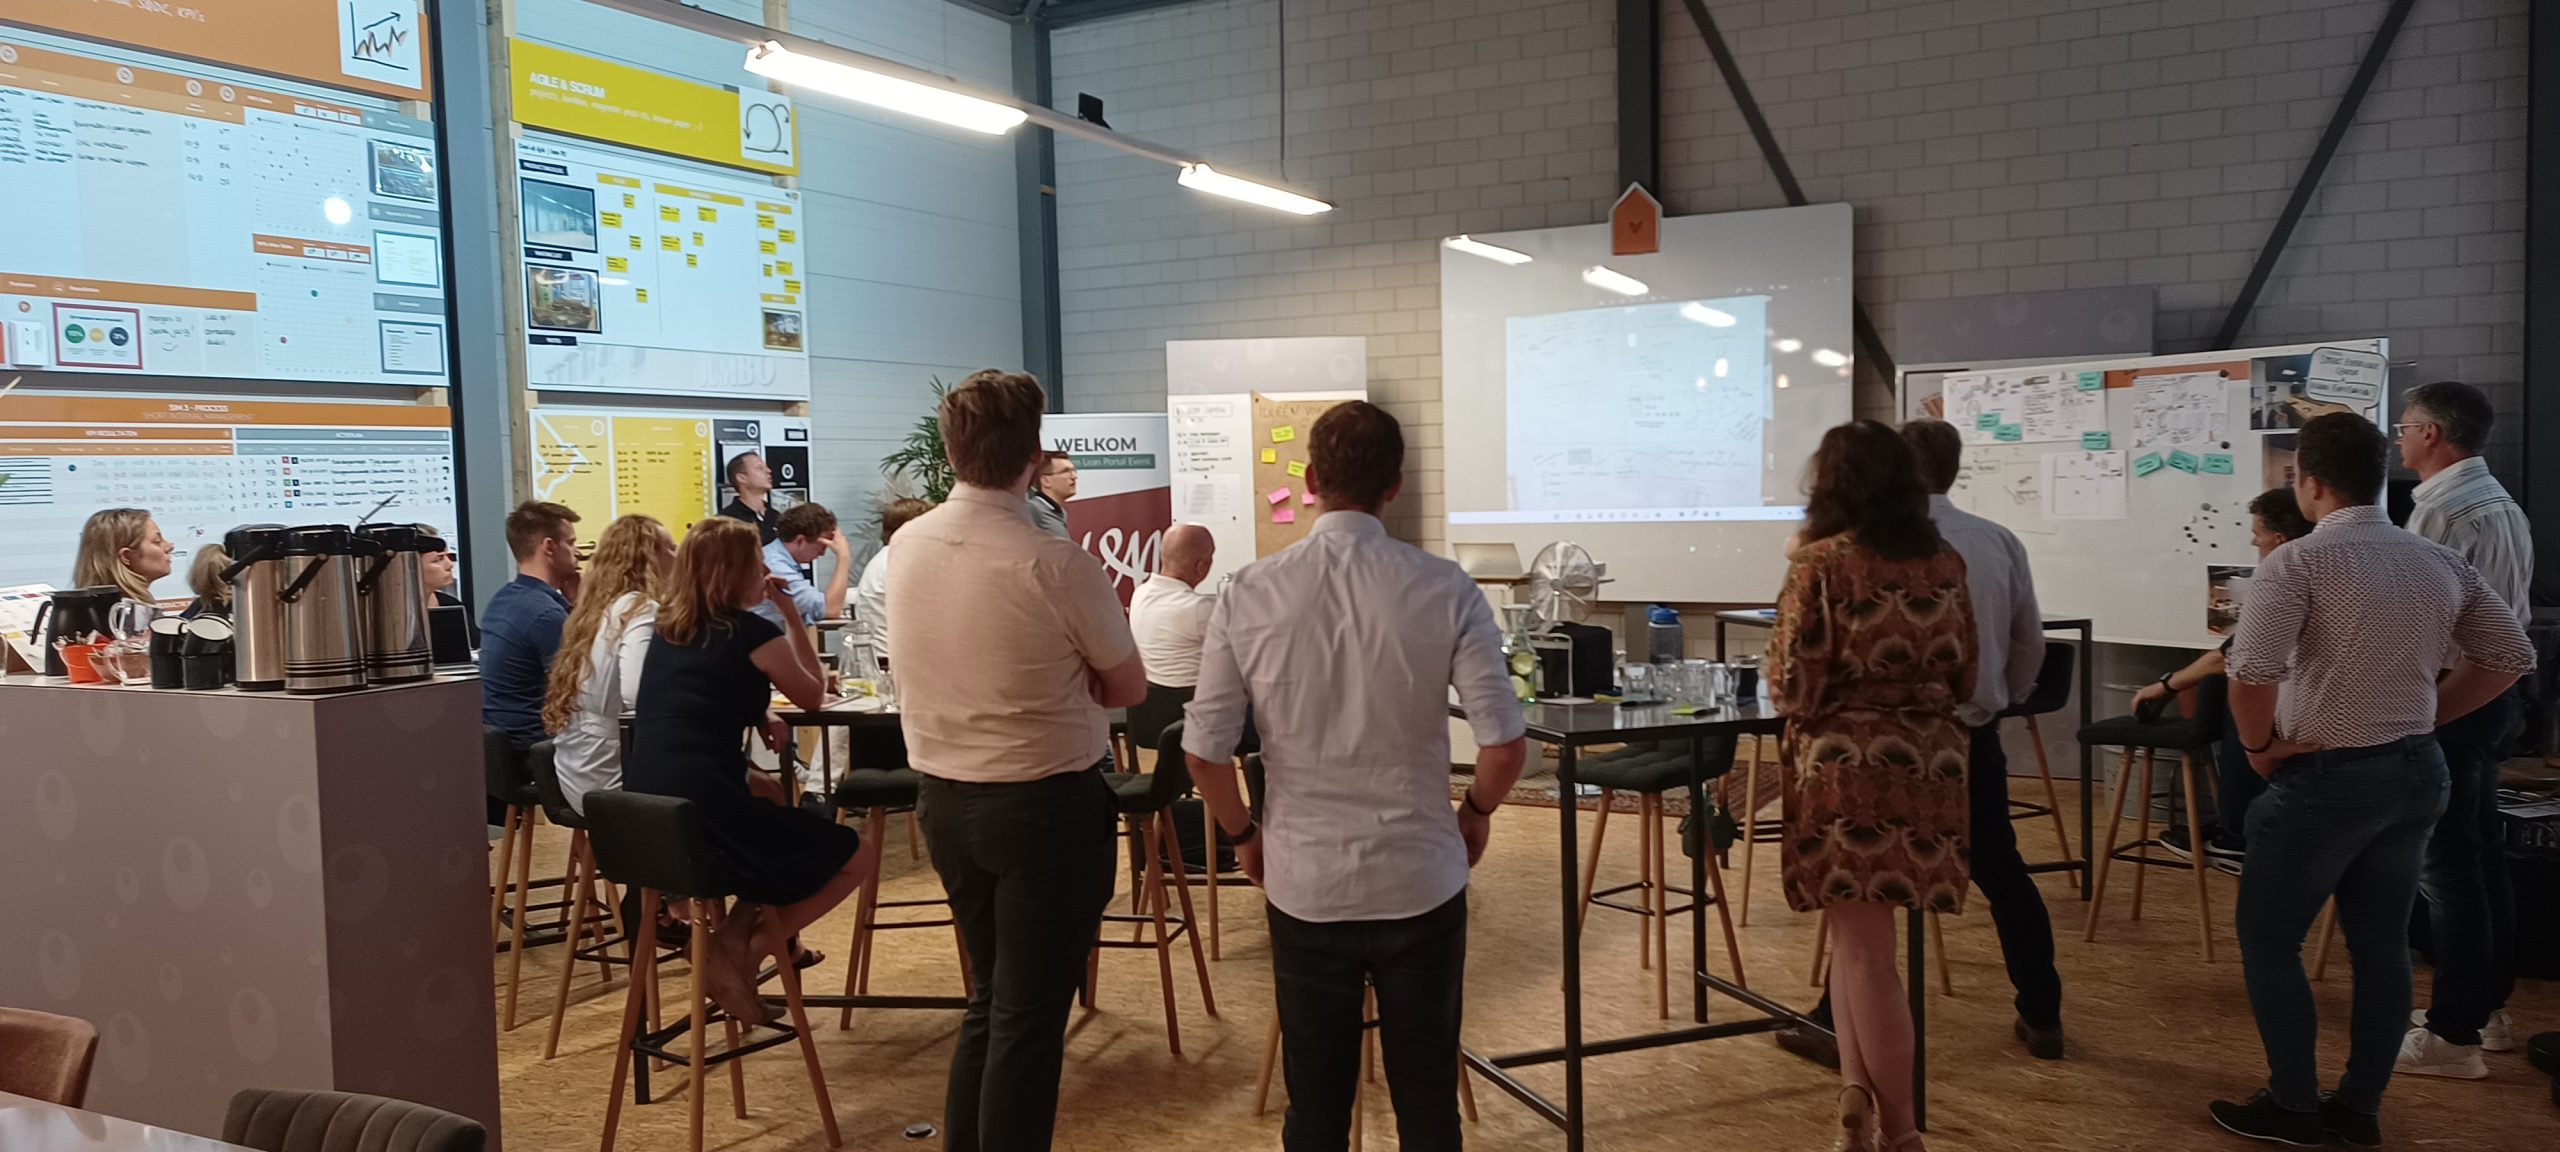
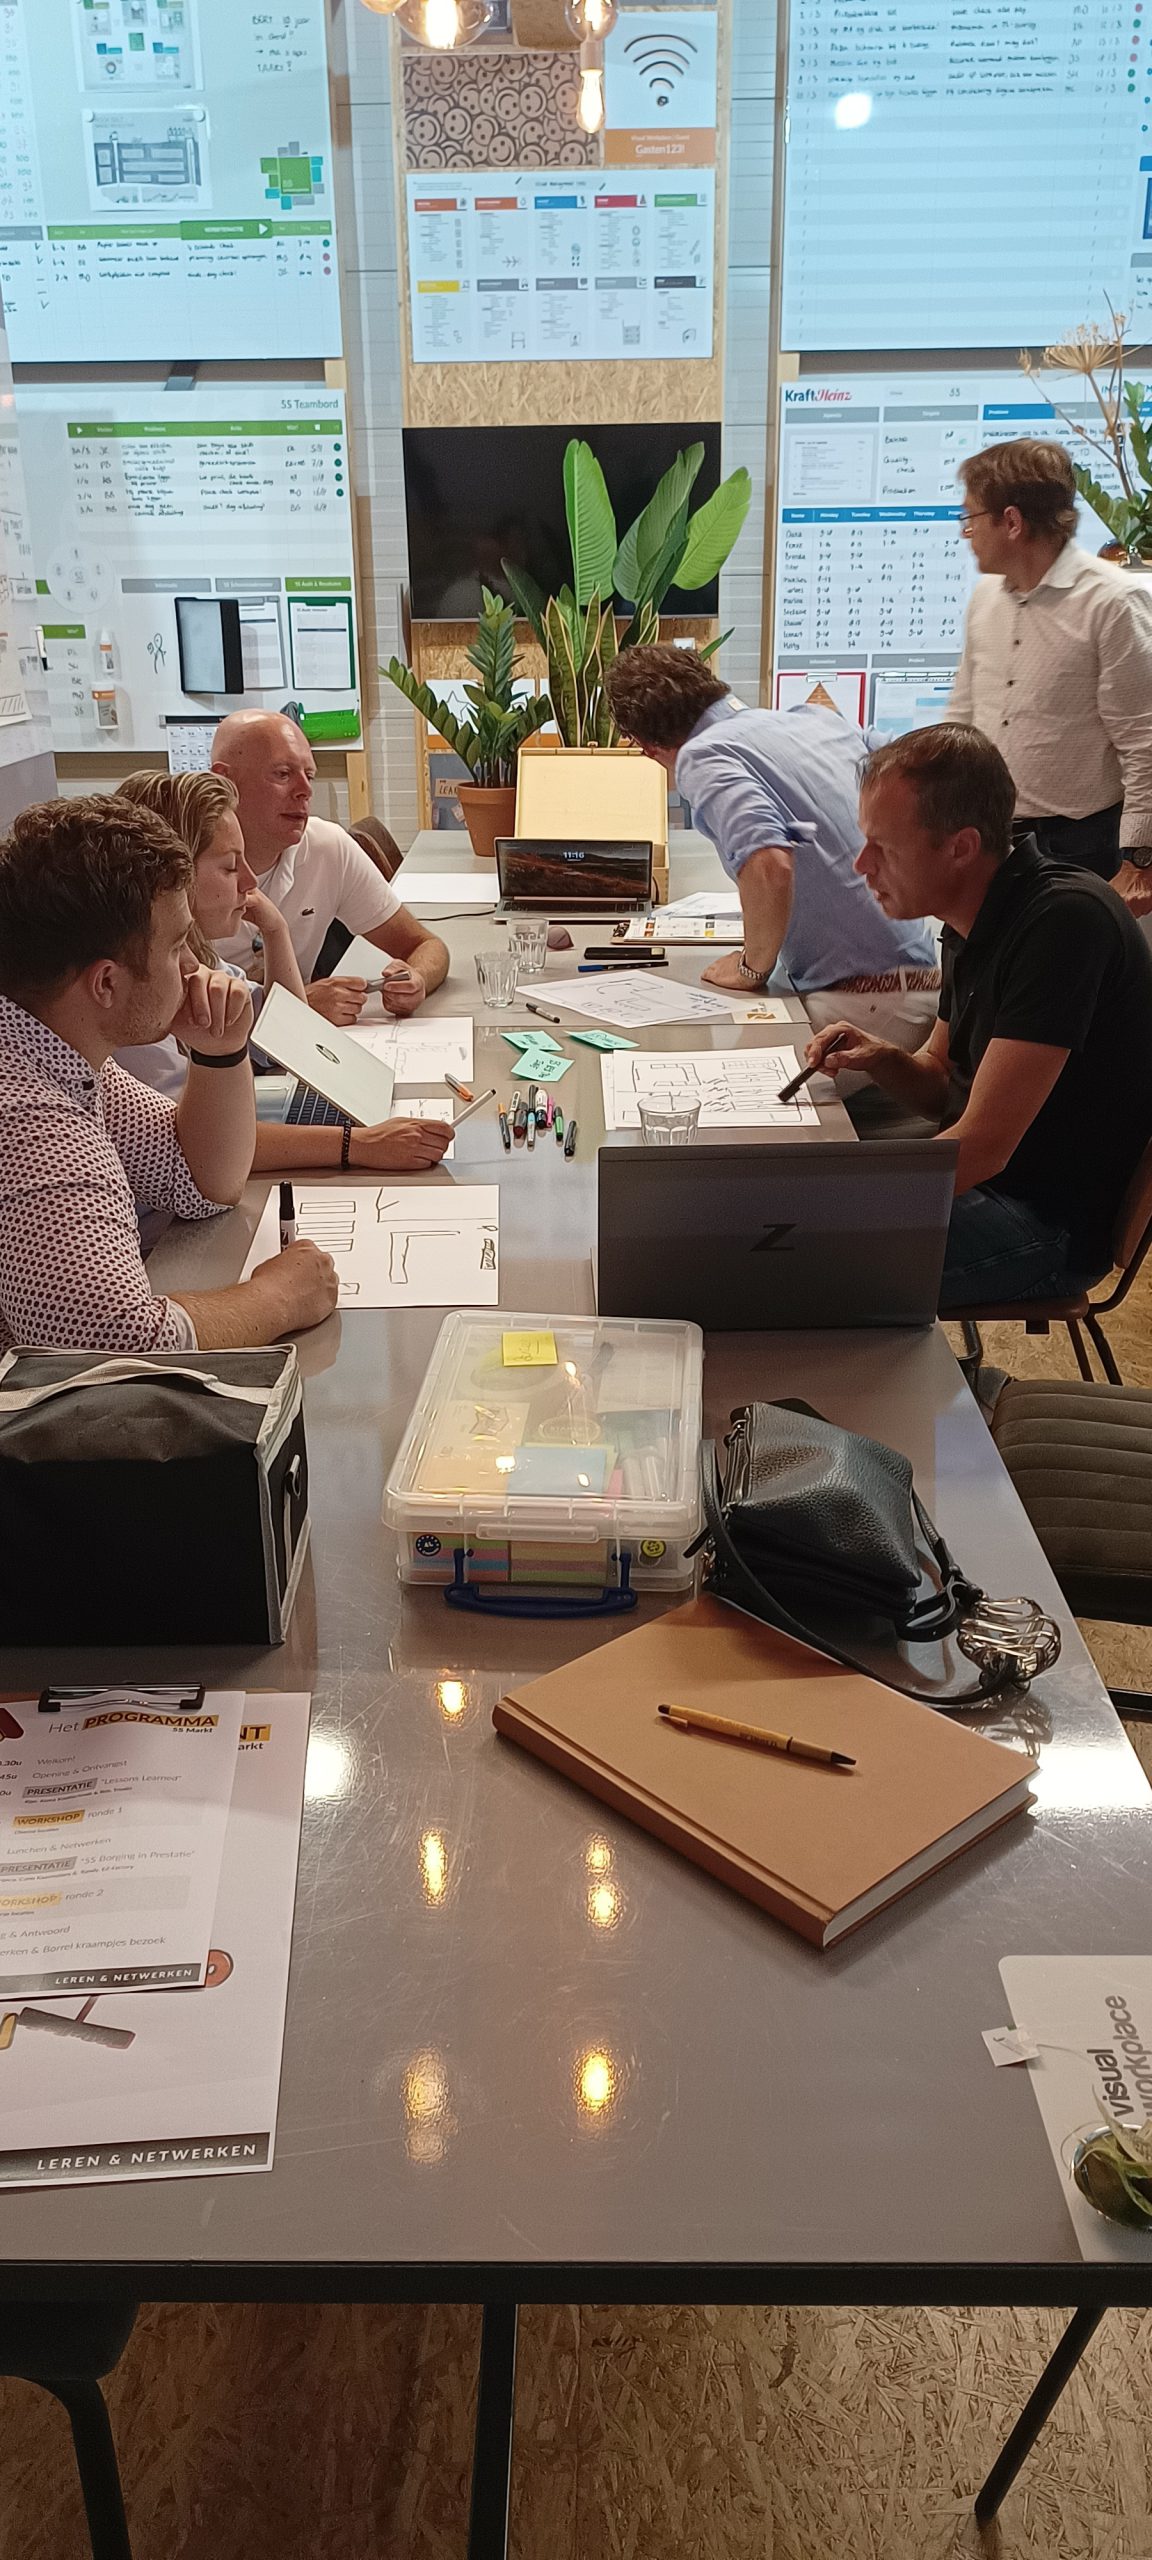
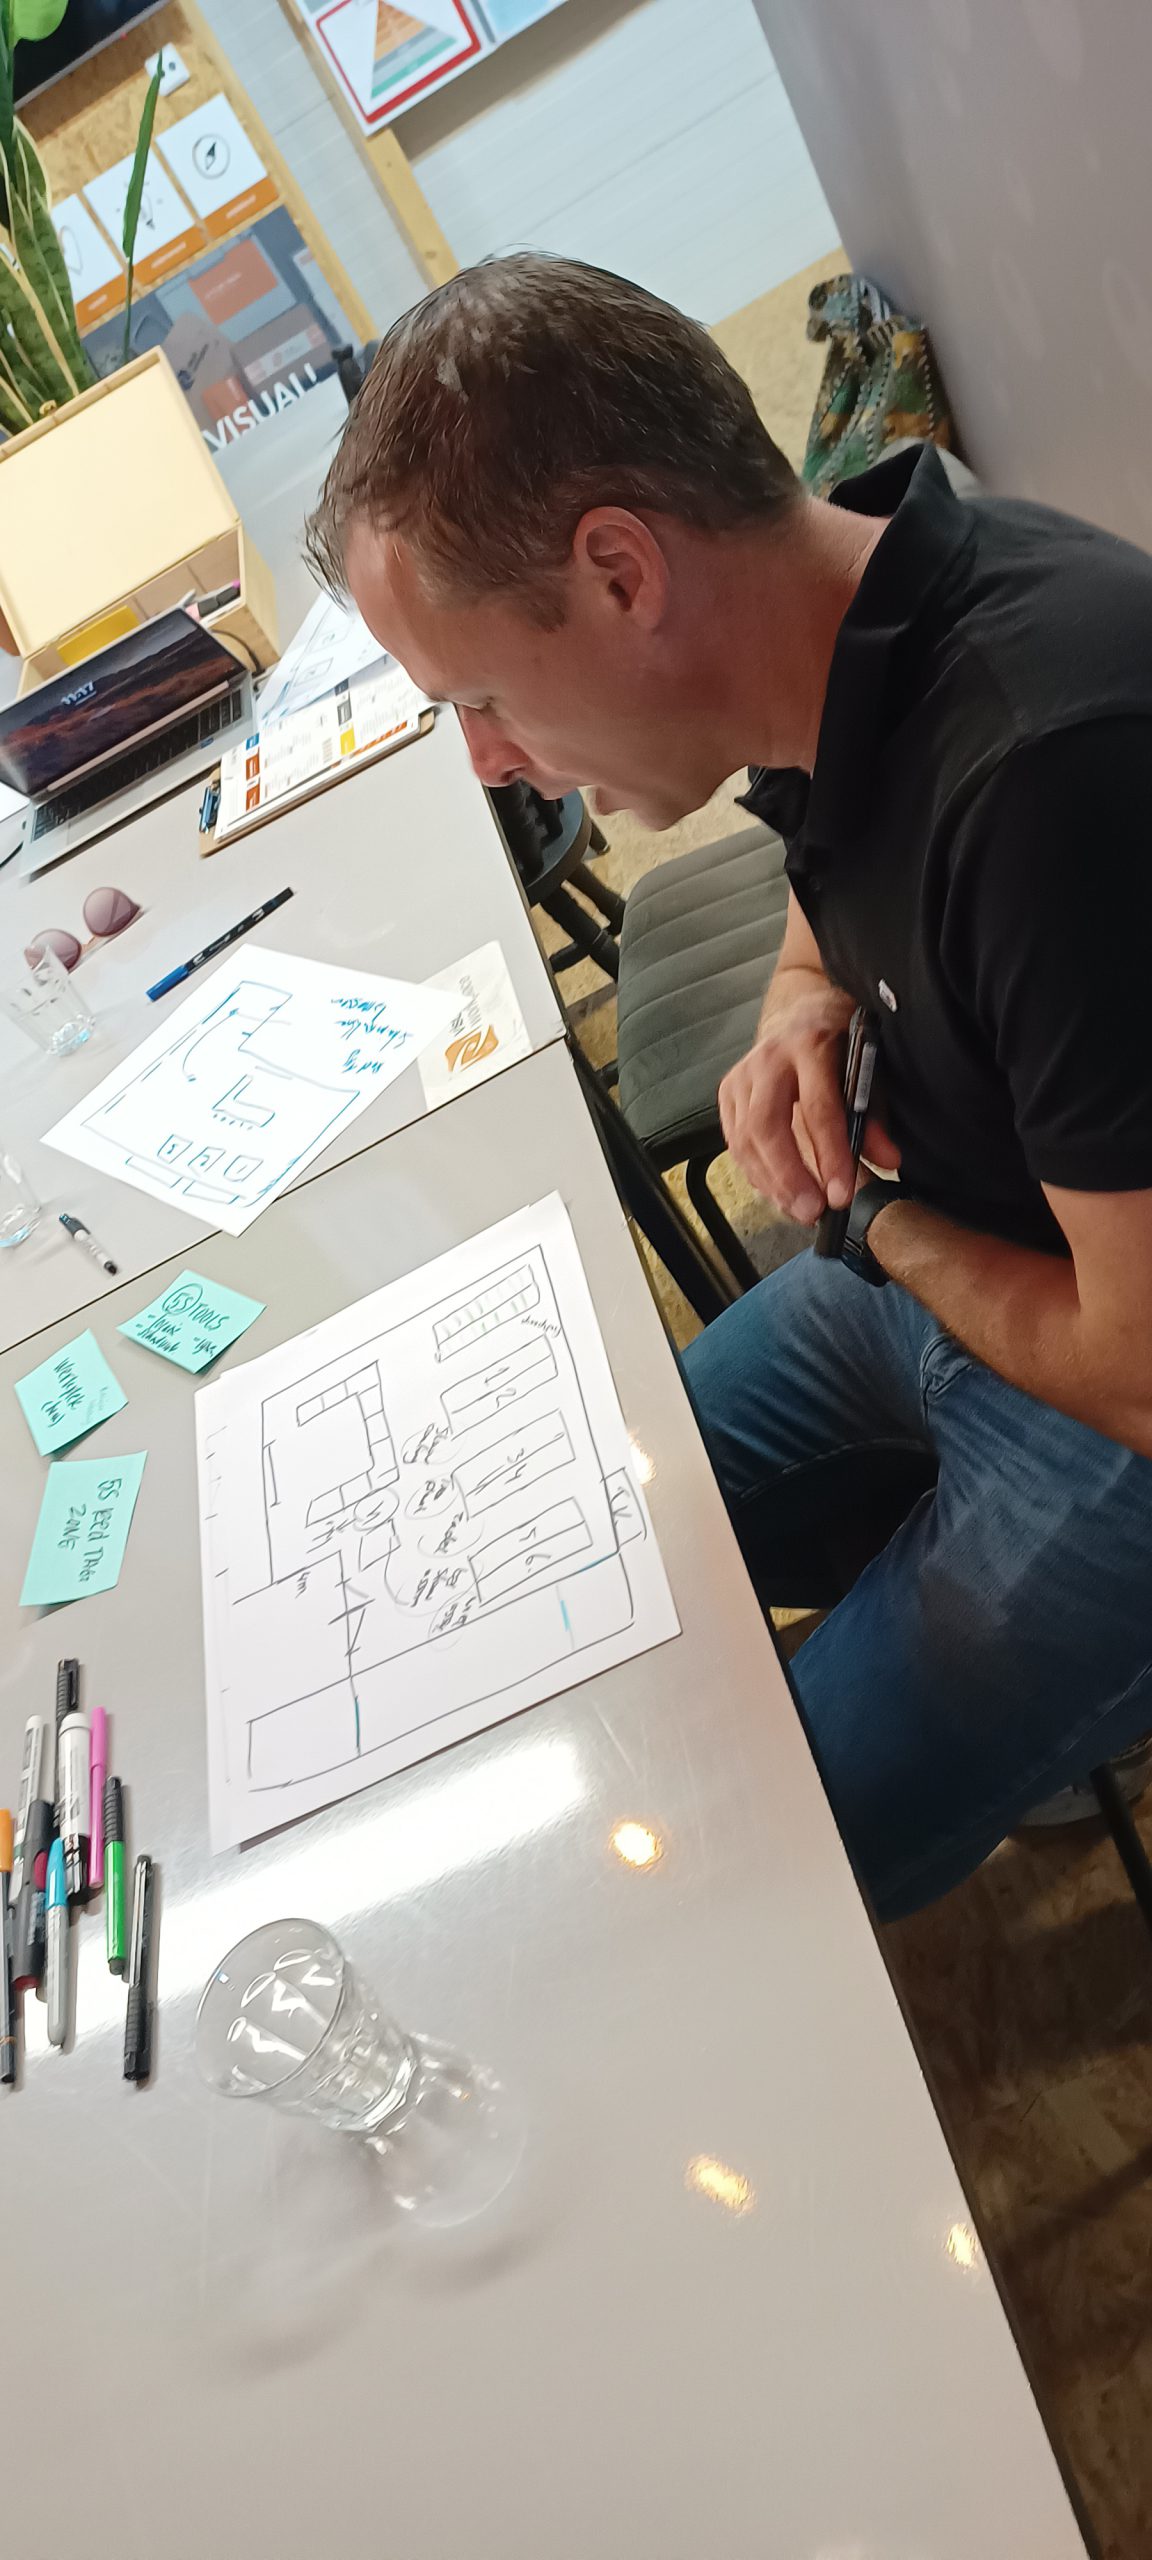
Symbol’s Consulting Day:
Visual Management and Six Sigma
Read on and discover how visual tools and methodologies increase our effectiveness and contribute to improvements.
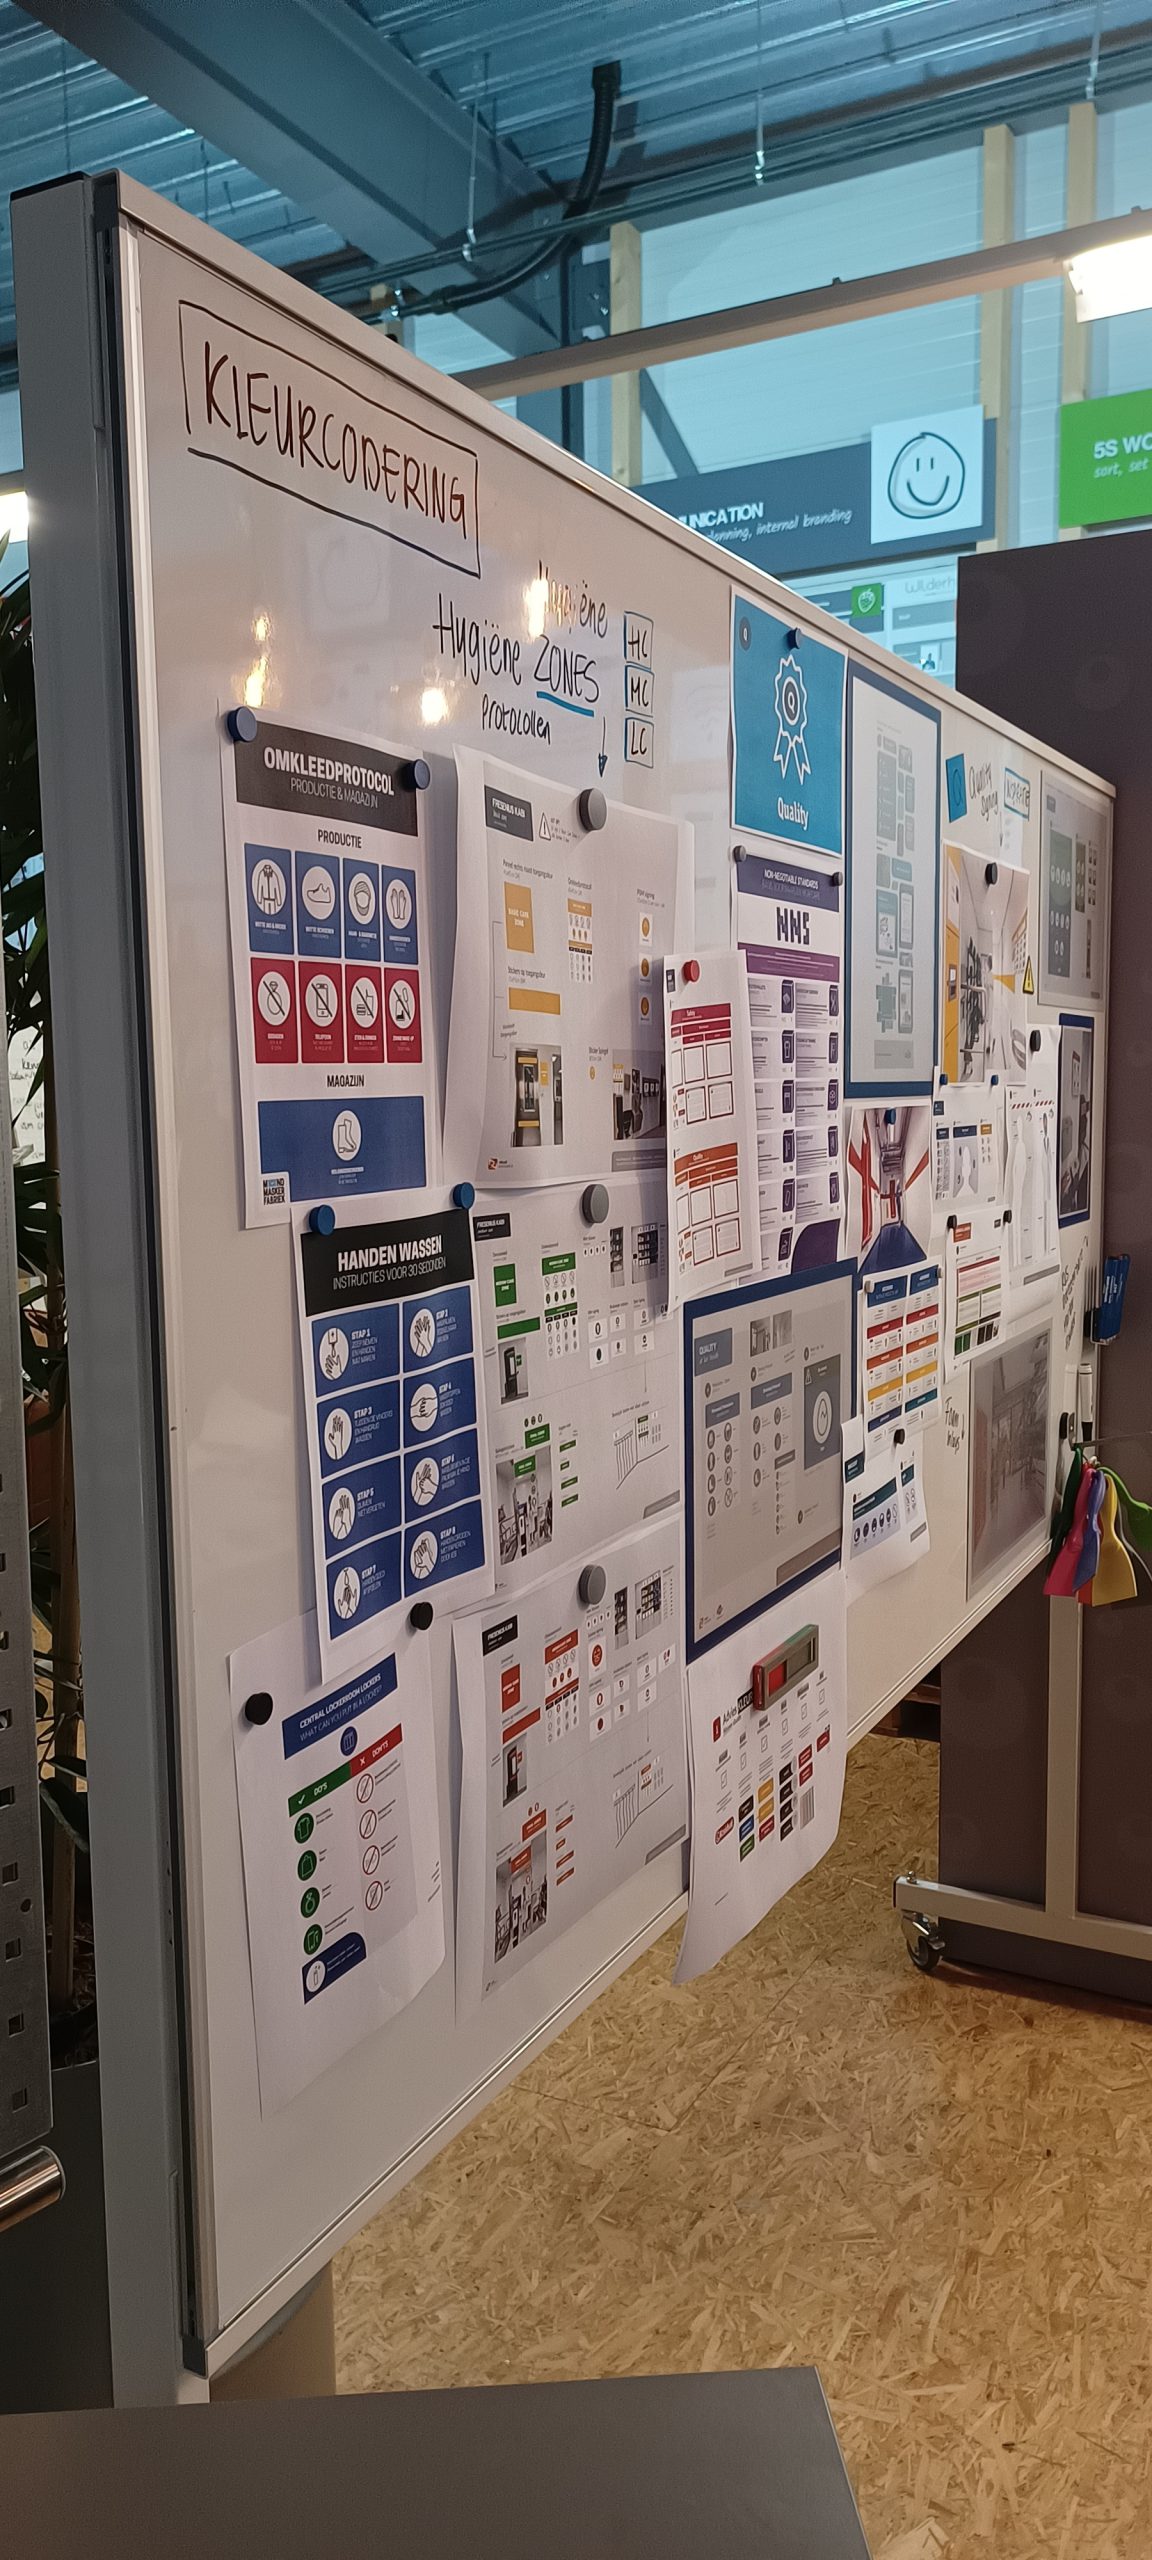
Visible improvement process
Visual Management, within the context of Six Sigma, focuses on creating a visual environment in which all relevant information is readily available. On our consulting day, we deepened our knowledge of how using visual tools such as diagrams, charts and signs helps us understand and communicate complex information. This allows us to quickly identify improvement opportunities and better understand where optimizations are needed.
Importance of visualization
One of the powerful aspects of Visual Management is the ability to display information in a visually appealing and understandable way. Presenting data and statistics in clear graphical form makes it easier to identify trends, patterns and anomalies. This enables us to make informed decisions and implement effective solutions that improve quality, efficiency and customer satisfaction.
Continuous Improvement with Six Sigma
The link between Visual Management and Six Sigma is strong. Six Sigma is a methodology aimed at reducing variation and improving processes to increase quality and reduce defects. By integrating Visual Management within a Six Sigma approach, we can visualize and better understand the complexity of data. This leads to more accurate measurements, better problem analysis and targeted improvements.
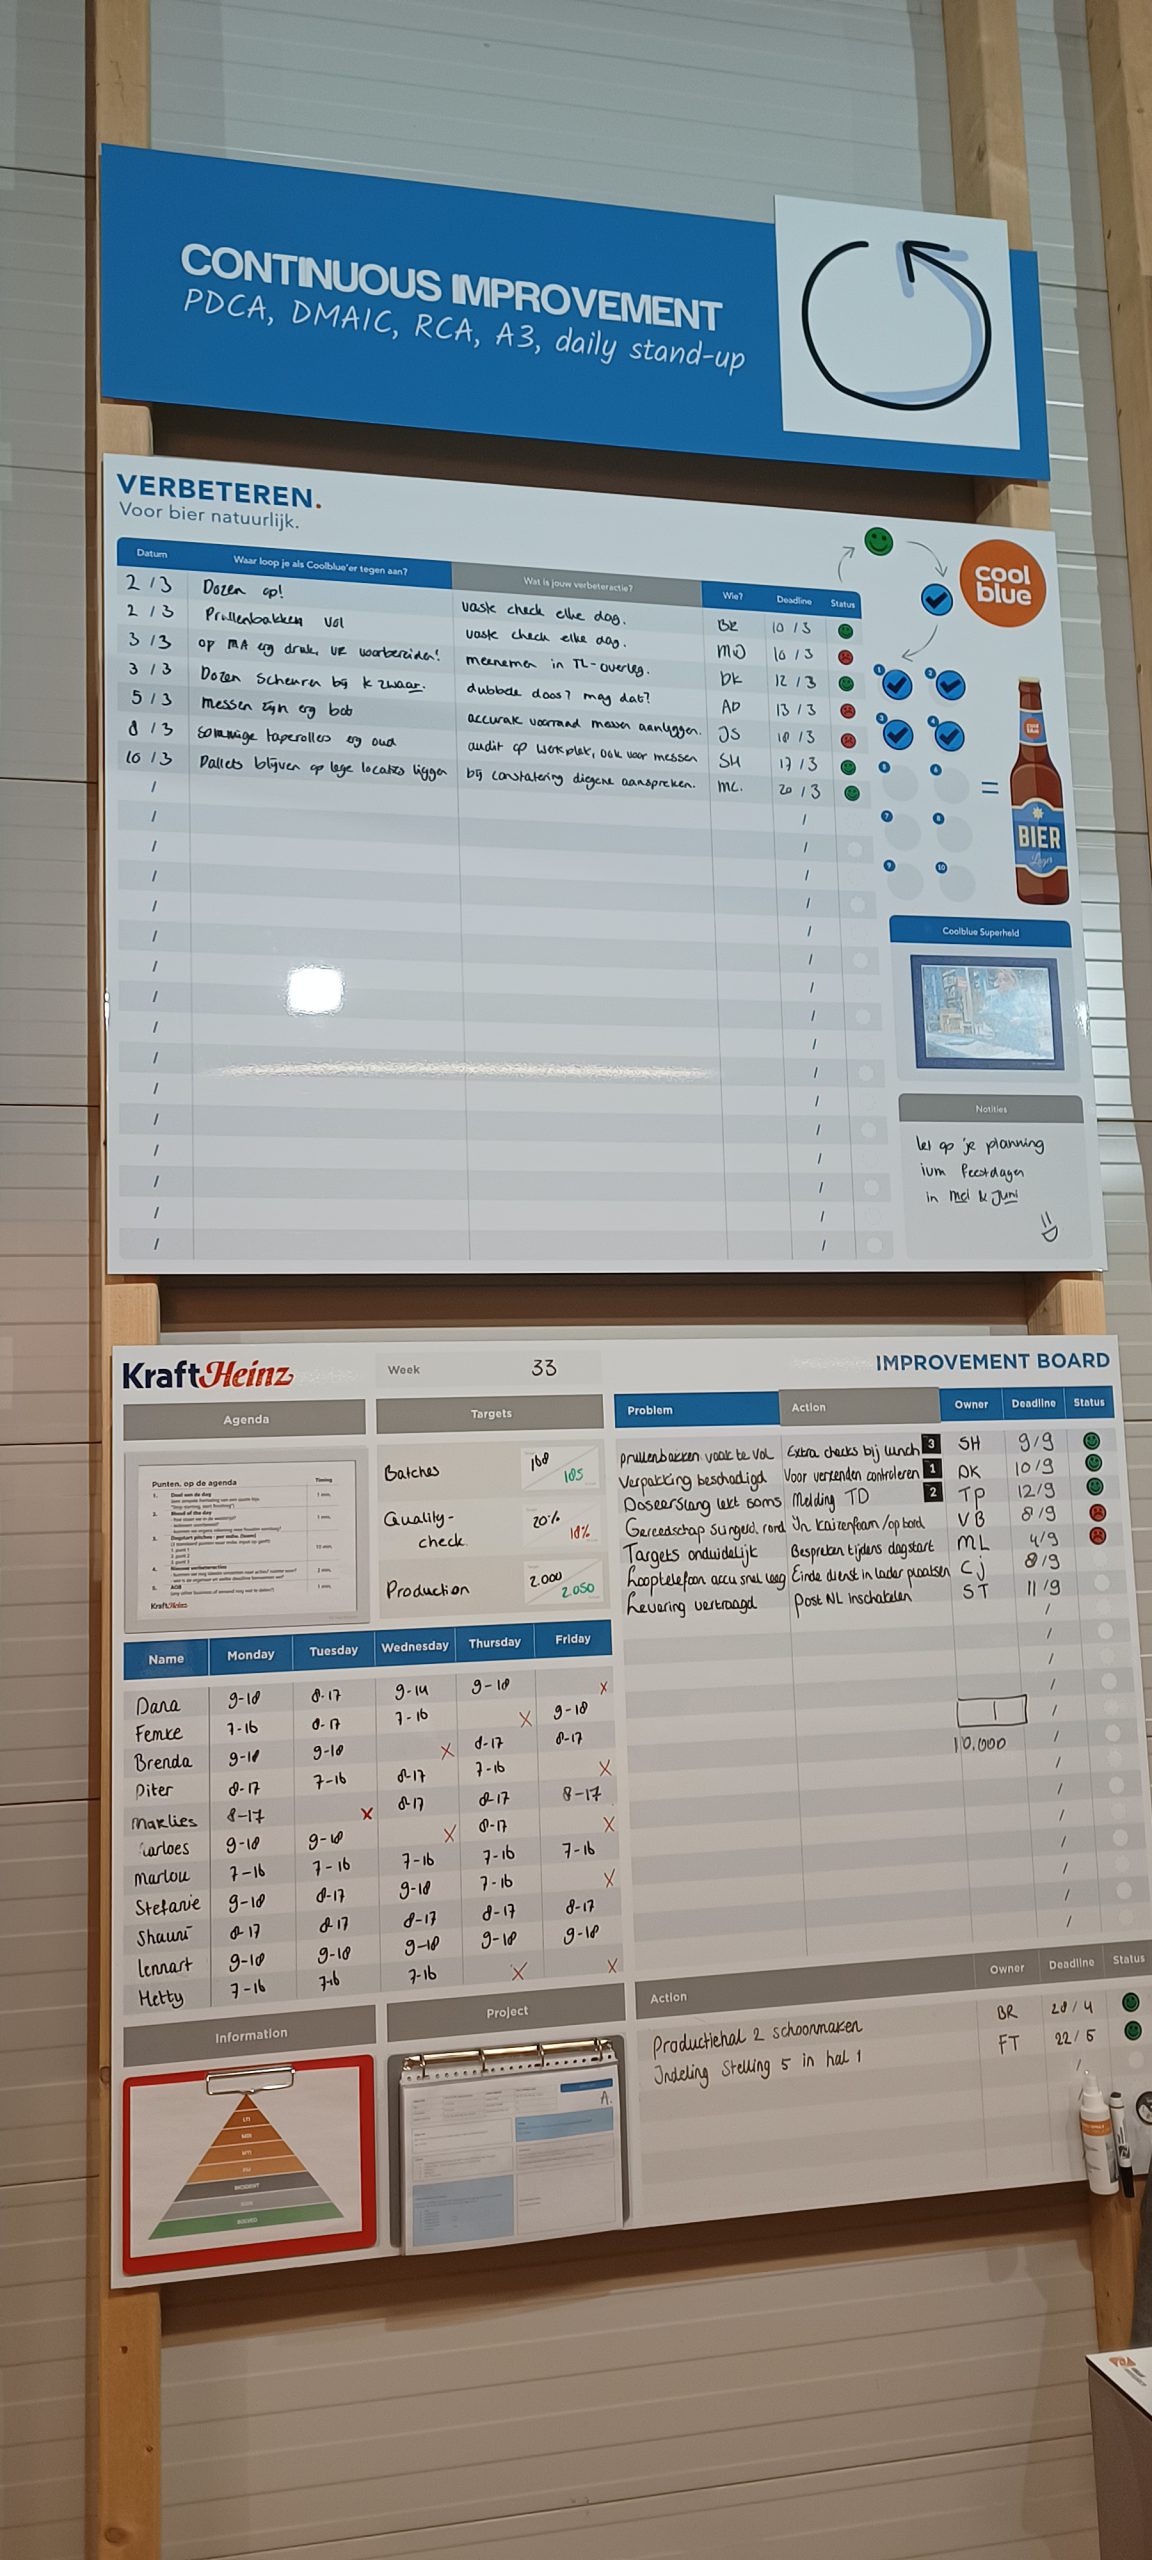
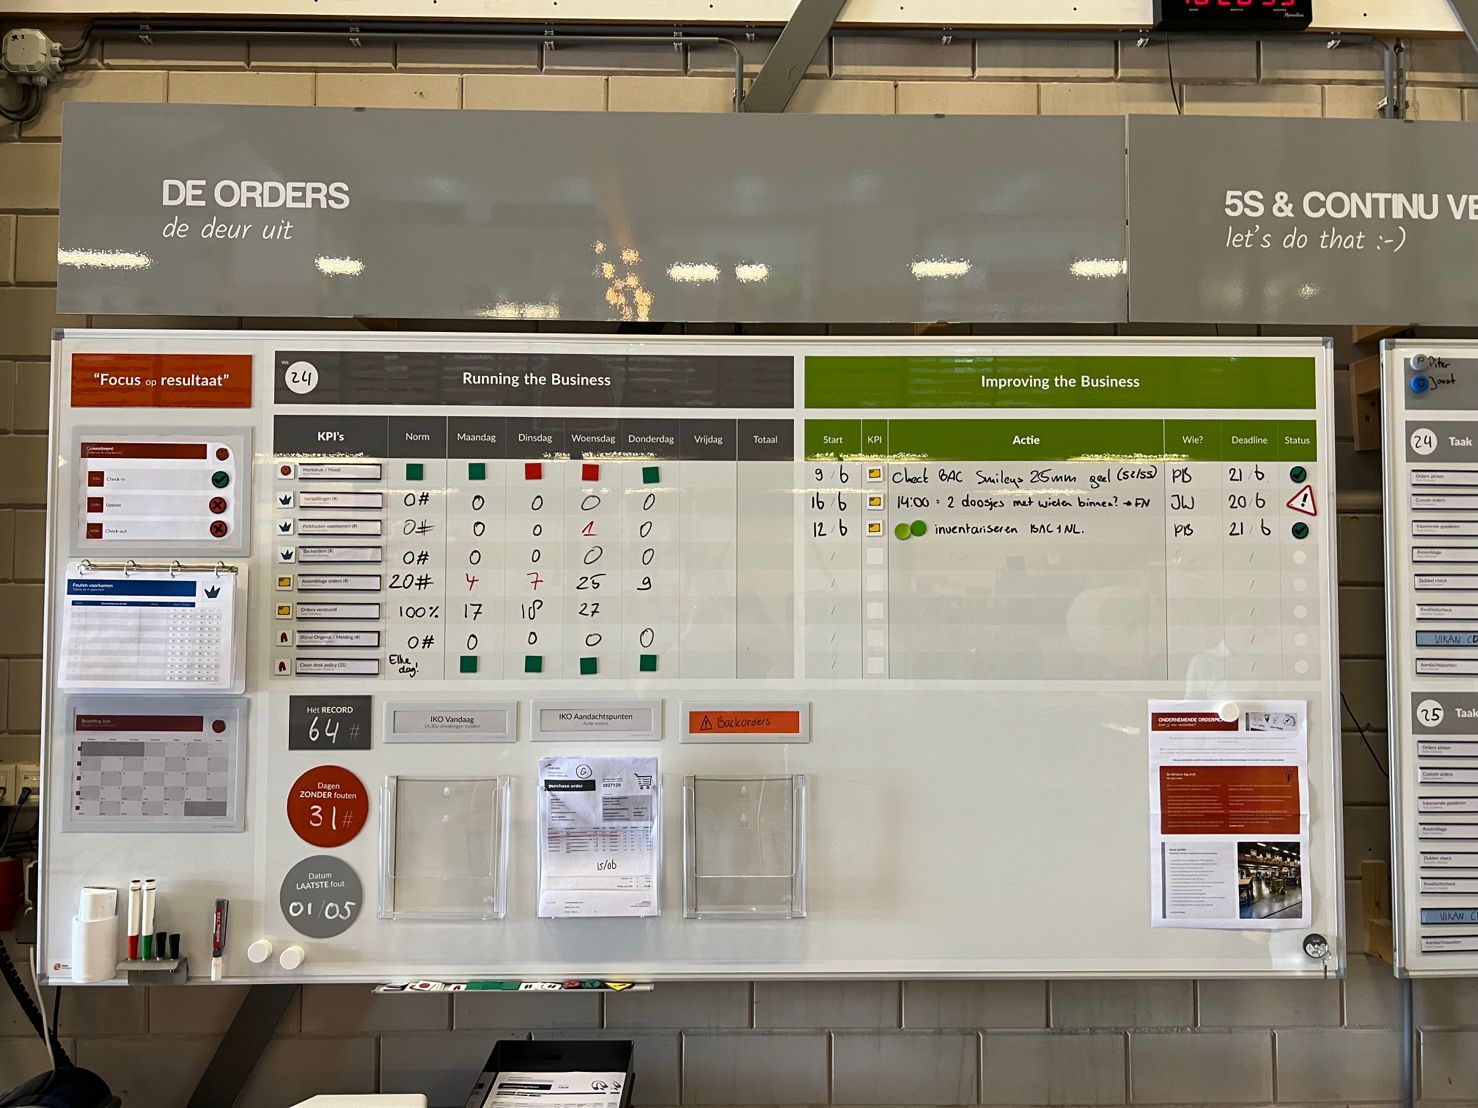
Results-oriented Implementation
Visual Management is not only a concept, but also a practical tool for implementing sustainable improvements. We further deepened the knowledge of our Young Professionals in, how visual tools such as Kanban boards, improvement dashboards and visual performance metrics help us track the progress of improvement initiatives and make the results visible. This allows us to celebrate successes, learn from failures and continually strive for higher levels of performance.
consultancydag_juni_2023_3
consultancydag_juni_2023_2
consultancydag_juni_2023_1
consultancydag_juni_2023_6
consultancydag_juni_2023_5
consultancydag_juni_2023_4
Also interesting to read

Join our Orange action
From ISO 9001 to IATF 16949As consultants with expertise in ISO 9001 quality management systems, we are often asked how best to transition to IATF 16949. For suppliers, certification according to IATF 16949:2016 is an important prerequisite to participate in the...

From ISO 9001 to IATF 16949
From ISO 9001 to IATF 16949As consultants with expertise in ISO 9001 quality management systems, we are often asked how best to transition to IATF 16949. For suppliers, certification according to IATF 16949:2016 is an important prerequisite to participate in the...

Improving focus: Initial results from our survey
Improvement in focus: Initial results from our research Every year, organizations invest hundreds of millions, if not billions, in optimizing their operations. These efforts vary widely; from launching small-scale lean or agile projects to developing sophisticated...